Use GDB on an ARM assembly program
Introduction
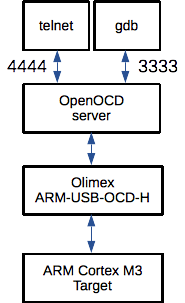
The goal of this article is to use the GNU Project debugger (gdb) on an ARM assembly program. We will use the same program and tools as in Run a minimalistic program written in assembler on STM32-H103 development board.
GDB documentation is available on the following links:
- GDB documentation start page: https://www.sourceware.org/gdb/documentation/
- GDB User Manual: https://sourceware.org/gdb/current/onlinedocs/gdb/
- GDB command and variable index: https://sourceware.org/gdb/onlinedocs/gdb/Command-and-Variable-Index.html
The GNU debugger mascot is the archer fish drawn by Jamie Guinan.

Debugging information
GDB needs debugging information in the elf file produced by the GNU Assembler (gas) to be able to do debugging. Section 4.1 in the GDB documentation explains how to compile for debugging. That section also refers to section 3.9 in the GCC documentation which describes the available command line options to produce the debugging information. I have not been able to find the corresponding documentation for the GNU Assembler but the same options seems to be valid.
-
-gis the basic option to produce debugging information. The format of the extra information will depend on the operating system being used. stabs, COFF, XCOFF and DWARF are examples of debugging information formats. -
-ggdbwill produce maximum amount of debugging information that can be understood by GDB but not by other debuggers. -
-gstabs+produces debugging information in the stabs format with extra extensions understood specifically by the GNU debugger.
Our command to compile with the GNU Assembler (gas) looks like below after adding the -g option:
arm-none-eabi-as -g -o add.o add.s
Starting GDB
You start by typing arm-none-eabi-gdb and exit by typing quit or hitting Ctrl-d.
Connecting GDB to OpenOCD server
We will run GDB on the PC host and the program on the STM32. OpenOCD is running as a server on the PC host and it accepts incoming connections from GDB on a port specified by the openocd.cfg file. See Using OpenOCD to flash ARM Cortex M3 for more information about OpenOCD. We will be using port 3333.
We will use the GDB target command to connect to OpenOCD. There are several subcommands depending on if the target is an executable, core file or on a remote machine. We will use the remote sub command.
The syntax is:
target remote host:port
We run OpenOCD on the local machine on port 3333 which gives us:
target remote localhost:3333
GDB documentation:
- Section 20 in the GDB documentation describes how to do remote debugging.
- Section 20.1.3 in the GDB documentation shows specifically the the syntax of
target remote.
Specifying the program to debug
GDB needs access to a file available on the host which is a copy of the program running on the target system. But the file on the host must contain symbol and debugging information. We showed how to include such information earlier using the -g flag. The file running on the target is stripped of this information when we run the arm-none-eabi-objcopy command to convert from elf to binary format.
We use the file command to tell GDB where the host file is located.
The syntax is:
file filename
In our case the name of the program which includes debugging information is add.elf:
file add.elf
GDB documentation:
- Section 18.1 in the GDB documenation explain more about the
filecommand syntax.
Reset target
We must reset the STM32 target before we can start our debug sessions. We do this by connecting to the OpenOCD server via tellnet and issue the reset halt command. See Run a minimalistic program written in assembler on STM32-H103 development board.
Run the program
We can run the program after doing reset by issuing the continue command in GDB.
(gdb) continue
Continuing.
The program will run until the infinite loop located at line 17 and 18 in add.s. We must do a Ctrl-C to get back to our GDB prompt.
(gdb) continue
Continuing.
^C
Program received signal SIGINT, Interrupt.
stop () at add.s:18
18      b stop
(gdb)
GDB documentation:
- Section 5.2 in the GDB documentation explains how to use the
continuecommand.
Stepping through program
We can step through our program line by line. Do a reset halt in telnet again and write step gdb.
(gdb) step
14      mov r3, #4
(gdb)
We can do multiple steps until we end up in the infinite loop again. At this point GDB will hang again and we have to do a Ctrl-C to get back to the GDB prompt.
(gdb) step
15      add r4,r2, r3
(gdb) step
stop () at add.s:18
18      b stop
(gdb) step
^C
Program received signal SIGINT, Interrupt.
stop () at add.s:18
18      b stop
(gdb)
GDB documentation:
- Section 5.2 in the GDB documentation explains how to use the
stepcommand.
Breakpoints
We can set a breakpoint at line number linenum by doing:
break linenum
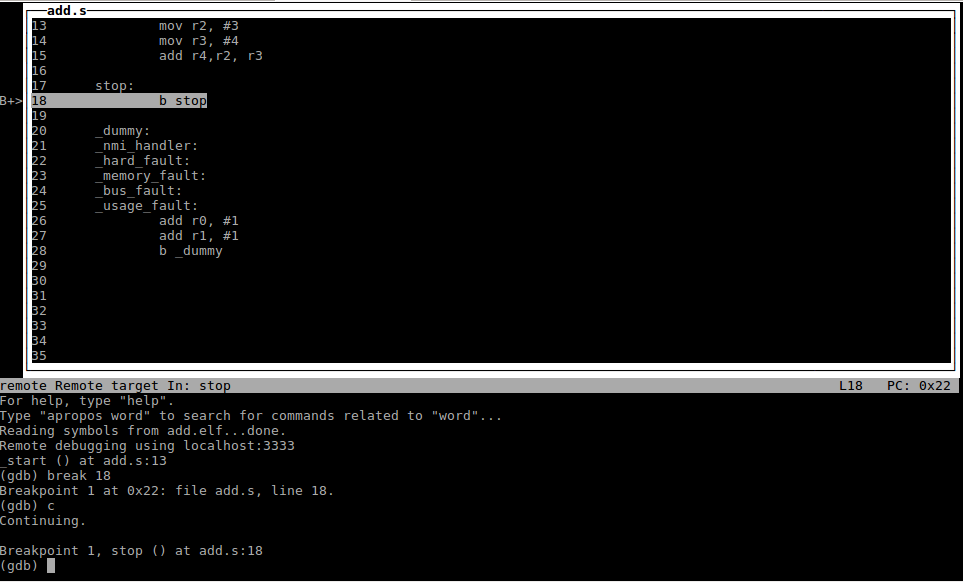
Let’s try this. First we do a reset halt in telnet again and then we issue the following command in GDB:
(gdb) break 18
Breakpoint 1 at 0x22: file add.s, line 18.
Below is a screenshot using the GDB Text User Interface (TUI) (see section below) where we have:
- Set a breakpoint on line 18
- Issued the
continuecommand - Program execution stopped on line 18
GDB documentation:
- Section 5.1.1 in the GDB documentation explains how to set breakpoints
Inspecting the program
We can learn about the state of our program through the info command.
info target shows the name of the file being debugged and how we are connected to the target.
(gdb) info target
Symbols from "/home/tdd/git/jmcode/stm32/arm_assembler_add_registers/add.elf".
Remote serial target in gdb-specific protocol:
Debugging a target over a serial line.
    While running this, GDB does not access memory from...
Local exec file:
    `/home/tdd/git/jmcode/stm32/arm_assembler_add_registers/add.elf', file type elf32-littlearm.
    Entry point: 0x0
    0x00000000 - 0x0000002a is .text
info program shows the address where the program is stopped
(gdb) info program
Debugging a target over a serial line.
Program stopped at 0x1e.
It stopped after being stepped.
Type "info stack" or "info registers" for more information.
info source shows information about the current source file. We can see the format of the debugging information among other things. This command will only shown information after starting to execute our program.
(gdb) info source
Current source file is add.s
Compilation directory is /home/tdd/git/jmcode/stm32/arm_assembler_add_registers/
Located in /home/tdd/git/jmcode/stm32/arm_assembler_add_registers/add.s
Contains 28 lines.
Source language is asm.
Producer is unknown.
Compiled with stabs debugging format.
Does not include preprocessor macro info.
info line shows the corresponding address for a specific line in the source code. This command will only shown information after starting to execute our program.
(gdb) info line 13
Line 13 of "add.s" starts at address 0x1c <_start> and ends at 0x1e <_start+2>.
info registers and info all-registers show current register values. info all-registers shows some additional registers compared to info registers.
(gdb) info all-registers
r0             0xfdbaffef   -38076433
r1             0xfdffffe5   -33554459
r2             0x3  3
r3             0x4  4
r4             0x7  7
r5             0xffdfffd4   -2097196
r6             0xcc4f5b53   -867214509
r7             0x8414de10   -2079007216
r8             0x37fefffe   939458558
r9             0xffedfffc   -1179652
r10            0xb3ba945c   -1279617956
r11            0xa8ced384   -1462840444
r12            0xfdf8ffff   -34013185
sp             0x0  0x0
lr             0xffffffff   -1
pc             0x1e 0x1e <_start+2>
xPSR           0x1000000    16777216
msp            0x0  0x0
psp            0xd080de44   0xd080de44
primask        0x0  0
basepri        0x0  0
faultmask      0x0  0
control        0x0  0
The pc (program counter) register shows the address where the program execution has been halted. r2, r3 and r4 are the registers set by our program.
GDB documentation:
- Section 16 in the GDB documentation gives information about the
infocommand among other things. - Section 10.13 in thhe GDB documenation gives inormation about the
info registersandinfo all-registerscommands.
Print source lines
We can study the source code of the program using the list command.
list *address, will show us the source code starting at the line corresponding to address. We can do this for address 0x1e for example, the register value for the pc register in the previous section.
(gdb) list *0x1e,
0x1e is at add.s:14.
14      mov r3, #4
15      add r4,r2, r3
16
17  stop:
18      b stop
19
20  _dummy:
21  _nmi_handler:
22  _hard_fault:
23  _memory_fault:
list linenum, will give us the source code starting at line number linenum.
(gdb) list 1,
1       .thumb
2       .section    isr_vector
3       .word       0
4       .word       _start + 1
5       .word       _nmi_handler + 1
6       .word       _hard_fault + 1
7       .word       _memory_fault + 1
8       .word       _bus_fault + 1
9       .word       _usage_fault + 1
10      .text
Typing list again will show the next couple of lines.
(gdb) list
11      .global _start
12 _start:
13      mov r2, #3
14      mov r3, #4
15      add r4,r2, r3
16
17 stop:
18      b stop
19
20 _dummy:
GDB documentation:
- Section 9.1 in the GDB documentation shows the
listsyntax.
Examining Memory
We can use the x command to examine memory at a certain address. We can for example study the value of the reset vector at adress 0x00000004 by doing
(gdb) x 0x00000004
0x4:    0x0000001d
The first 13 lines of add.s looks like this:
Address Line
        1       .thumb
        2       .section    isr_vector
0x00    3       .word       0
0x04    4       .word       _start + 1
0x08    5       .word       _nmi_handler + 1
0x0C    6       .word       _hard_fault + 1
0x10    7       .word       _memory_fault + 1
0x14    8       .word       _bus_fault + 1
0x18    9       .word       _usage_fault + 1
        10      .text
        11      .global _start
0x1C    12  _start:
        13      mov r2, #3
The _start: label is located at address 0x1c according to the info line command. The reset exception handler address is set to 0x1d which is 0x1c+1. The +1 is needed in order to show that the code at this location is from the Thumb instruction set, see section 2.3.4 in the STM32F10xxx Programming Manual.
(gdb) info line 12
Line 12 of "add.s" is at address 0x1c <_start> but contains no code.
GDB Documentation:
- Section 10.6 provides more information on how to examine the memory
Set program and connect to remote target from command line
We can connect to the remote target and specify what program to debug directly from the command line when invoking GDB.
arm-none-eabi-gdb --eval-command="target remote host:port" program
-
The
--eval-commandsets a GDB command to execute directly after starting. -
The first argument without the
--or-prefix is interpreted by GDB as the program to debug.
In our case we get:
arm-none-eabi-gdb --eval-command="target localhost:3333" add.elf
GDB documenation:
- Section 2.1.1 in the GDB documentation gives some information about these command line options.
TUI (Text User Interface)
GDB offers a text based user interface that shows the source file and gdb commands in separate windows. The TUI mode is enabled by invoking gdb with the -tui option. You can also enable and disable TUI while running GDB through tui enable and tui disable.
TUI offfers the following key bindings among others:
C-x 1
    Use a TUI layout with only one window. The layout will either be ‘source’ or ‘assembly’. When the TUI mode is not active, it will switch to the TUI mode.

    Think of this key binding as the Emacs C-x 1 binding.


C-x 2
    Use a TUI layout with at least two windows. When the current layout already has two windows, the next layout with two windows is used. When a new layout is chosen, one window will always be common to the previous layout and the new one.

    Think of it as the Emacs C-x 2 binding.


C-x o
    Change the active window. The TUI associates several key bindings (like scrolling and arrow keys) with the active window. This command gives the focus to the next TUI window.

    Think of it as the Emacs C-x o binding.
C-L
    Refresh the screen.
See section 25.2 in the GDB documentation for more TUI key bindings.
TUI offers a command to change the layout:
layout name
    Changes which TUI windows are displayed. In each layout the command window is always displayed, the name parameter controls which additional windows are displayed, and can be any of the following:

    next
        Display the next layout.
    prev
        Display the previous layout.
    src
        Display the source and command windows.
    asm
        Display the assembly and command windows.
    split
        Display the source, assembly, and command windows.
    regs
        When in src layout display the register, source, and command windows. When in asm or split layout display the register, assembler, and command windows.
See section 25.4 in the GDB documentation for more TUI commands.
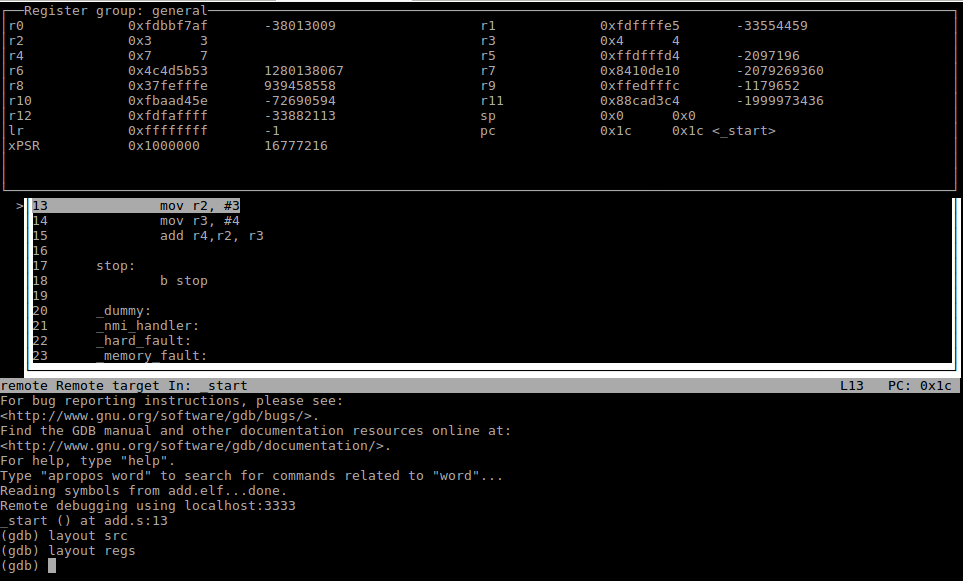
Below is a screenshot after starting gdb with
arm-none-eabi-gdb -tui --eval-command="target remote localhost:3333" add.elf
Followd by the following layout commands
layout src
layout regs